Procedure Queries
Procedure queries is the built-in communication channel for all users in the software. Queries can be opened at the field level and the form level for procedures and subject logs by Data Managers, Monitors, and Safety Users. Each form or field can have multiple queries issued in separate threads with each getting closed by Data Management, Monitors and Safety Users once they have been resolved.
In this article
- Query Workflow
- Status Descriptions
- Status Counts
- Query Listing Tab
- Roles and Query Workflow
Query Workflow
The following steps make up the query workflow:
1. Site user enters data and/or uploads source.
2. Data Management, Monitor, and Safety User can issue a query on the form level or field level of a procedure or subject log.
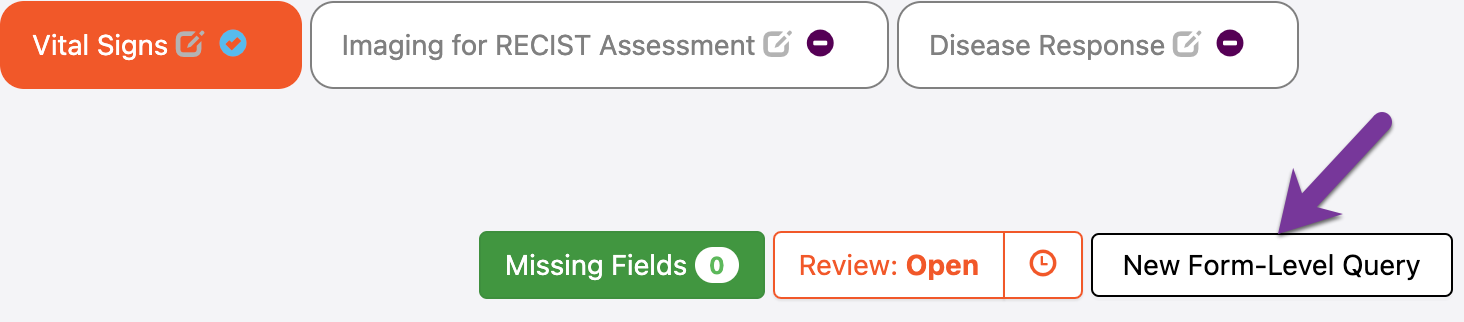
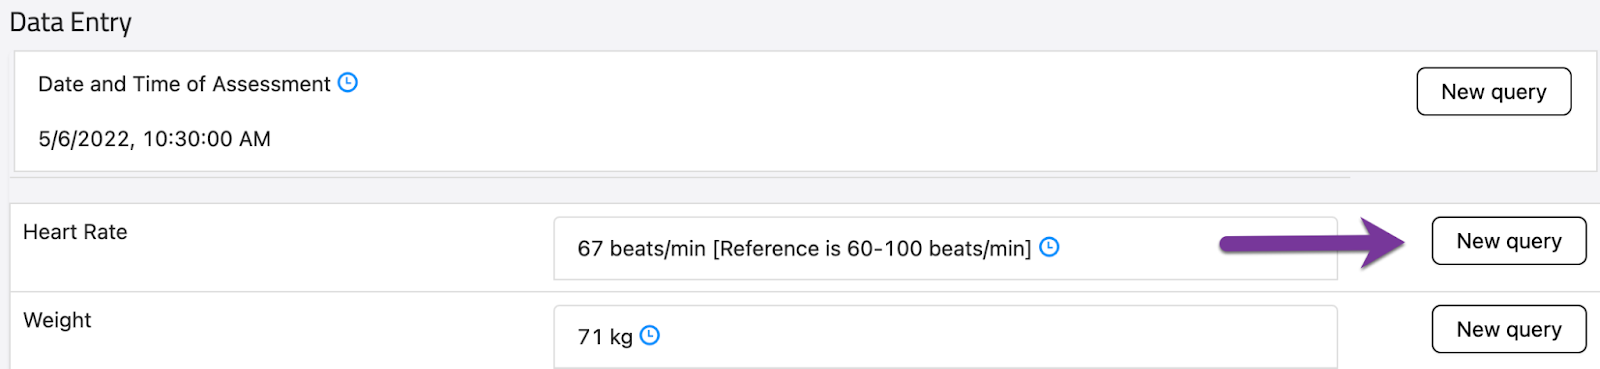
- To generate a query, click on the New Form-Level Query or New Query button, enter the query message in the comment box in the query panel on the right side then click Submit.

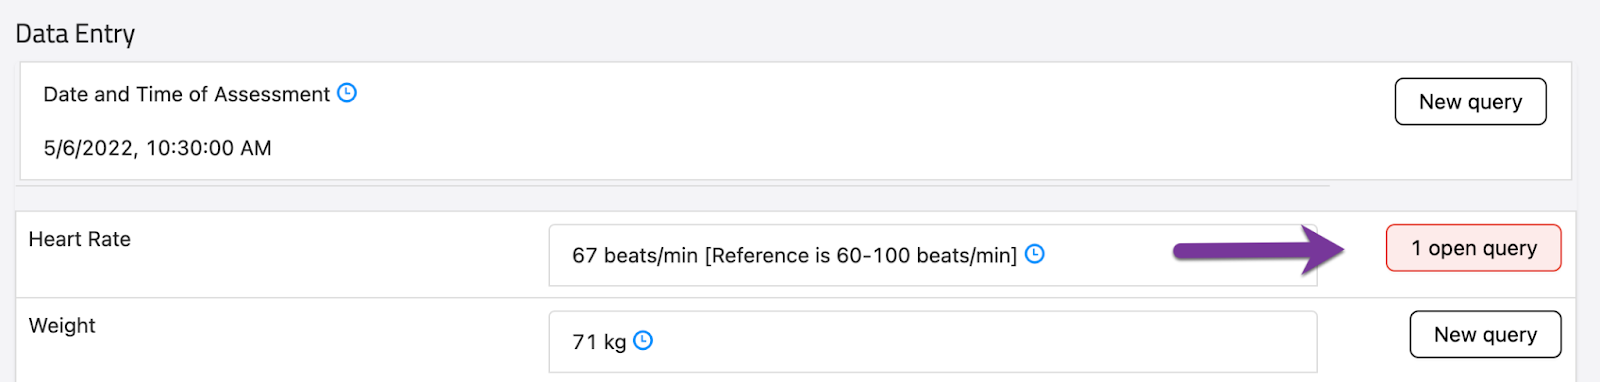
- When a query is issued, the red query count button will appear on the procedure and/or field it is issued on. The query count under Query Status column in site list, subject list and subject's visit schedule will also be updated with an increment of 1 for the red circle.

5. Site User or Principal Investigator can answer queries issued on the form level and field level of a procedure or subject log.
- To answer a query, open the CRF or log row and click on Form-Level Query button or the red box on the field level to bring up the query panel on the right side, enter the response and click Reply


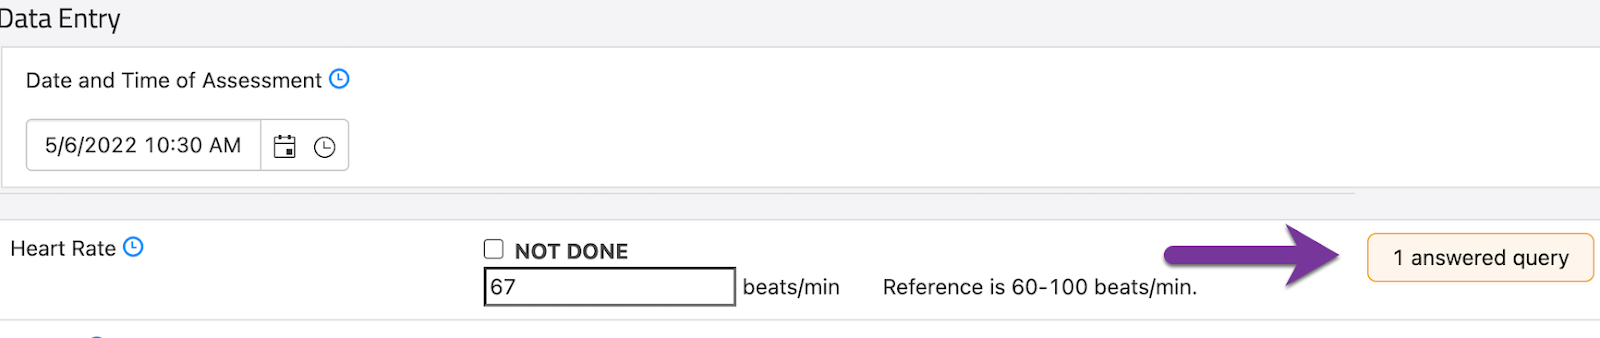
- When there is a response to the open query, the query count button will turn yellow with an updated label, indicating the query is answered. The count of answered queries in the yellow circle under Query Status column will be updated with an increment of 1.


6. Data Management, Monitor and Safety User can add a response or mark the query closed after it has been answered. Once a query is marked closed the Query button will turn back to white. The query status will then reflect closed and be shown in green.


Note: Data Management, Monitor, and Safety User can open a query on a procedure of subject log entry at any time regardless of the form’s submission status. Once the query is issued, the procedure or subject log entry will be unlocked for additional data entry without changing the submission status. The form will be locked again when all queries on the form are answered by Site User/PI or marked as closed by Data Management/Monitor/Safety User. This is also true with automated query opened on forms with Submitted or Reviewed status.
- If a form or field has only closed queries, Data Management, Monitor and Safety User can view the closed queries by clicking on the
New Form-Level Querybutton on the form level or theNew Querybutton on the field level and then click on theView Closed Querieslink.

Status Descriptions
Each query will have the following statuses:
- Open - The query has been opened and is awaiting a response by the site user or PI
- Answered - The query has been responded to by the site and is awaiting review by data management, monitor or safety user
- Closed - The query has been either 1) closed by data management, monitor or safety user or 2) closed as a result of a data update and the clearing of an Automated Data Review query.
Query Status Counts
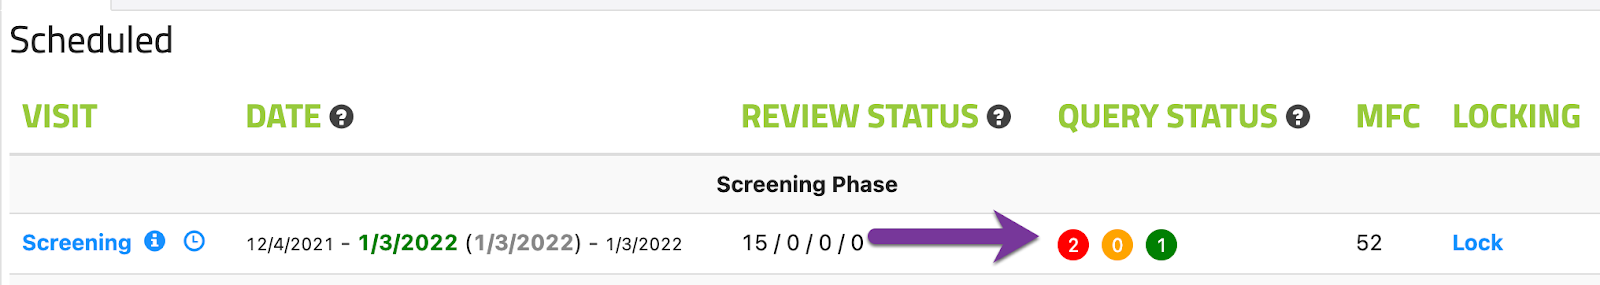
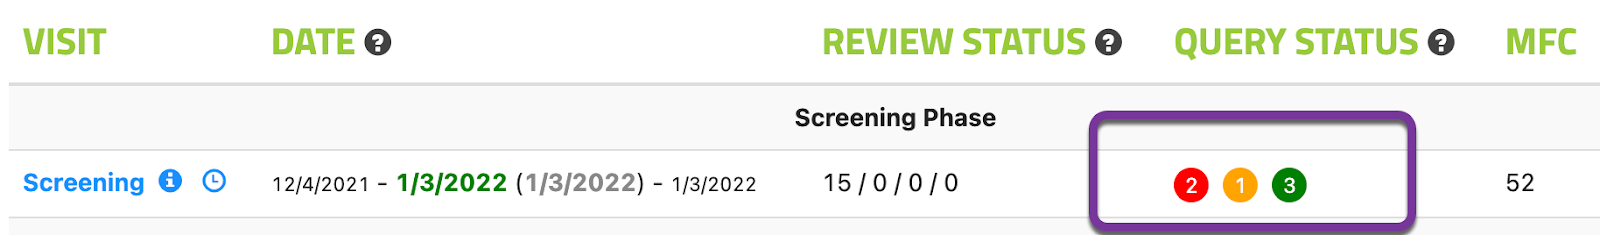
The current count of queries of each status is displayed and rolled up from subject visits, to subjects, and finally to the site level under the column labeled Query Status. Status counts are displayed in the format "Red/Yellow/Green” where:
- Red = number of open queries waiting on the site, or PI
- Yellow = number of answered queries waiting on data management, monitor or safety user
- Green = number of closed queries
Queries Listing Tab
The Queries tab lists all manual and automated queries with all of their details. Data Management, Monitor, Safety User, PI, Site User, Auditor and Read Only User have access to the Queries tab that displays query information of sites they are given access to. The Queries tab can be filtered by Query ID, Site, Subject, Status and sorted by Status, Last Modified Date. It can be searched by Visit, Procedure and Field. From the queries tab, you can download the query listings by clicking on the Download listing button into an Excel file.

Each row in the Queries tab links directly to the query panel containing the query thread. To bring up the query details in a side panel without leaving the home screen, hover over the row of the chosen query so it will be highlighted in grey, then click on any white space in that row. The query side panel will be brought up on the right side.


Roles and Query Workflow
The following matrix lists the actions each user role can perform in the query workflow.
| Role/Action | Open Query | Answer/Reply Query | Close Query |
| Data Management | x | x | x |
| Monitor | x | x | x |
| Safety User | x | x | x |
| Principal Investigator |
|
x |
|
| Site User |
|
x |
|
|
|
|
|
|
Timezones
Timestamps in audit trail of query actions are displayed as follows:
-
Exact timestamp in the query panel when the viewer hovers over the relative timestamp: timezone set up on viewer's device and will be updated accordingly if the viewer changes their timezone setting

-
In Queries tab, the Last Modified column is in the timezone set up on viewer's device and will be updated accordingly if the viewer changes their timezone setting.

- In the Query Listing, the following datetime columns are in the timezone set up on viewer's device and will be updated accordingly if the viewer changes their timezone setting.
- Manual Query Listing tab:
- Open Datetime
- Answer Datetime
- Close Datetime
- Automatic Query Listing tab:
- Open Datetime
- Answer Datetime
- Close Datetime
- Manual Query Listing tab:

